


Blog
Best Practices for Logging in MarkLogic
- 13 May, 2024
- By Dave Cassel
An important element in software development is understanding what's happening as your application runs. The user interface should provide responses to user actions, including informative messages when something goes wrong. For the development team to get deeper insights, we turn to logging for more detailed information. In this post, we'll look at some options for logging in Progress MarkLogic.
Logging Options
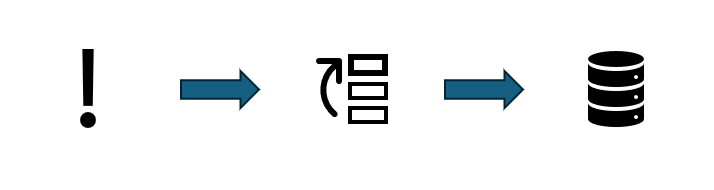
There are several functions we can use to put information into MarkLogic's error log, including:
- xdmp.log
- console.log (and friends)
- xdmp.trace (and xdmp.traceEnabled)
- console.trace
xdmp.log and console.log
The first two are pretty similar in intent, with minor differences in the output. Both xdmp.log and console.log are intended to take their parameter and represent it in the error log, along with a timestamp. There are a couple differences.
First, xdmp.log takes a second parameter, which is the log level ("error", "info", "debug", etc.). console.log takes an arbitrary number of parameters, each of which will be written to the log. There are other related functions, like console.error, console.debug, and so on. In either case, a MarkLogic application server has a log level setting that defaults to "info", but can be changed to other levels when either more or less logging is desired.
It's worth noting that the output of the two is slightly different. They do exactly the same if given a simple string or other scalar value: the log file will give you the parameter. We start to see some differences if we pass in an array or object.
xdmp.log(['this is xdmp.log', 'with an array']);
console.log(['this is xdmp.log', 'with an array']);

xdmp.log({msg: 'this is xdmp.log'});
console.log({msg: 'this is xdmp.console'});
This produces:
2024-05-10 16:42:24.598 Info: ["this is xdmp.log", "with an array"]
2024-05-10 16:42:24.598 Info: [ this is xdmp.log, with an array ]
2024-05-10 16:42:24.598 Info: {"msg":"this is xdmp.log"}
2024-05-10 16:42:24.598 Info: { msg: this is xdmp.console }
Calling xdmp.log with an array gives you that same array in the log file. With console.log, we still have two items in the array, but the quotation marks have been dropped. Likewise, the quotation marks are gone when logging an object with console.log. This isn't a big difference, but if you have something parsing your log files, dropping the quotation marks produces invalid JSON. That may not be a problem in some cases, but if I'm logging this type of information, it's probably so that I can copy and paste something from the log file into Query Console. For me, that's a win for xdmp.log.
xdmp.trace
At a glance, we might think that xdmp.trace and console.trace are related, as with their .log siblings. This isn't the case, however; they do different things.
xdmp.trace is a way of turning logging on or off at a feature level, rather than using an application-wide logging level. By feature level, I mean that we can define trace labels for particular parts of our code.
For example, perhaps you have an automated approval process for a workflow. You might want some basic logging most of the time, but if start to see problems, you want to get more detail about how that part of the code is running. If we turn up the logging level for the application server, we'll get a lot more detail on everything, which may make it difficult to find the information about the approval process.
With xdmp.trace, we can set up logging that is only written if the trace is enabled. Consider this code:
function doSomething(myParam) {
  xdmp.trace('MY_TRACE', `doSomething called with ${myParam}`);
  // the function's implementation goes here
}
Normally this message will not be printed. We can turn it on using the Admin UI by going to the Diagnostics section under the group that has the application server. We change "Trace Events Activated" to "true", then enter the "MY_TRACE" label in the list of events before hitting "OK". The next time the doSomething function is run, we'll get that trace message in the error log.
The trace label can be any string. I like to define constants for them. This lets me keep a list of them in one place and ensure I don't make a typo in one of the calls.
For cases where more than one application is deployed to a MarkLogic instance (or might possibly be someday), I like to prefix the trace label with a short application reference. Since turning on trace events is done at the group level, this can help track where each of them is meaningful.
Something else to consider: in some cases, your trace statement may require some computation to figure out what to print. When we call xdmp.trace, the information we pass in needs to be calculated whether the trace is active or not. If that calculation is non-trivial, it's better to skip it. We can do that by wrapping the call in xdmp.traceEnabled.
function doSomething(myParam) {
  if (xdmp.traceEnabled(TRACE_DO_SOMETHING)) {
    xdmp.trace(TRACE_DO_SOMETHING, `doSomething called with ${complexCalculation(myParam)}`);
  }
  // the function's implementation goes here
}
Now the calculation will be skipped unless this particular trace event is enabled.
console.trace
I mentioned that xdmp.trace and console.trace are different. The xdmp.trace function is MarkLogic specific, providing a way to interact with the trace events feature. The console.trace function is a general JavaScript function that works like console.info except that it also prints a stack trace. This can be very helpful when trying to reconstruct something that went wrong.
Note that if you call console.trace in a catch, the stack trace may not be as helpful as you'd like. Consider the two console.trace calls in this code that I ran in Query Console.
function doSomething() {
  const doNothing = null;
  if (doNothing === null) {
    console.trace('error detection');
    throw new Error("boom");
  }
}

try {
  doSomething();
} catch (err) {
  console.trace('Bummer', err);
}
Here's what we get in the log:
2024-05-10 17:36:43.046 Info: Trace: error detection
2024-05-10 17:36:43.046 Info:+ at doSomething ([anonymous]:6:13)
2024-05-10 17:36:43.046 Info:+ at  ([anonymous]:12:3)

2024-05-10 17:36:43.046 Info: Trace: Bummer {}
2024-05-10 17:36:43.046 Info:+ at  ([anonymous]:14:11)
I added a blank line to separate what we get from the two calls. Note that the call from the catch only shows you where the catch was -- not the location of the error that led to the exception. The call within doSomething is more informative.
Conclusions
Here's what I've settled on for best practices:
- I prefer
xdmp.logoverconsole.logbecause what it writes is more true to what I pass in. This is helpful when sending JSON to the log for exploration in Query Console. - Use
xdmp.traceto provide detailed logging on a feature level. This enables us to get more information about a particular process without writing an overwhelming amount of content to the logs. - Use
console.traceto track where an error comes from, but do this when your code can detect an error, not after catching one. This can be particularly helpful for utility functions that may be called from a variety of places, making it hard to recreate an error.
Apply these tips in your MarkLogic code to get more insights into how your application is working!
Share this post:
4V Services works with development teams to boost their knowledge and capabilities. Contact us today to talk about how we can help you succeed!


An important element in software development is understanding what's happening as your application runs. The user interface should provide responses...